The primary objective of investing in real estate is for cash flow and appreciation, but just because an investment property has a positive cash flow and appreciates does not make it a “buy.” A property must produce enough cash flow and equity to provide an acceptable return for the amount of cash invested [1] . In other words, the return on investment needs to be adequate enough to make the investment successful. So, if cash flow and equity are major components of the investment strategy, how does one properly measure them against the needed investment capital?
There are many ways to calculate the rate of return on an investment property. One formula is the Cash-on-Cash Return with Equity (COCE), also known as the Return on Equity (ROE). This ratio is a fundamental financial measurement used in calculating the annual rate of return on the “net” equity (or “trapped equity”) in a property. Cash-on-cash return with equity helps an investor understand if a property should continue to be held or if he or she should sell it. The calculation also helps to offset the short-comings of the traditional cash-on-cash return by incorporating the annual property appreciation and the annual principal payments of debt into the formula.
Before we discuss how cash-on-cash with equity is calculated, let’s first go over how the traditional cash-on-cash return is calculated. The cash-on-cash return provides a snap-shot view of the investment’s performance for a particular year as the amounts used in the calculation are not cumulative. In other words, the calculation only looks at the year in question (measurement year), ignoring the cash flow from other years. Since the cash-on-cash return takes a snap-shot of the property, the concept of the time-value of money is not involved.
The cash-on-cash return is a ratio with the property’s annual “net” cash flow, either before or after incomes taxes, as the numerator. The denominator, on the other hand, is the initial investment or down payment. Since the denominator is the initial investment, the denominator is fixed and never changes.
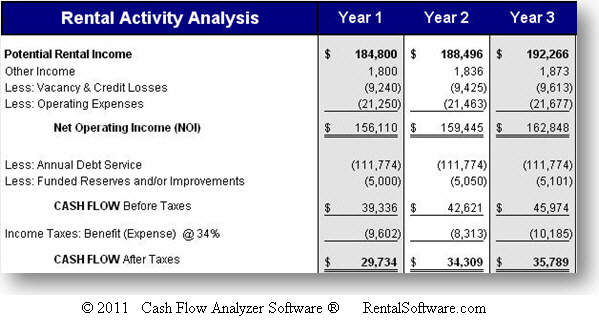
Let’s review the following analysis as an example of the cash-on-cash return ratio:

As you can see from the above cash flow analysis, the cash flow after taxes for Year 1 is $29,734. The cash flow is calculated by taking the potential rental income, adding any other income to it, and then subtracting vacancies, expenses, debt payments, funded reserves and income taxes.
In this example, we assume an initial investment of $562,250. The cash-on-cash return in this situation is 5.29% ($29,734 / $562,250) for Year 1. For Year 2, the cash on cash return is 6.1% ($34,309 / $562,250). For Year 3, the cash on cash return is 6.37% ($35,789 / $562,250).
Are 5.29%, 6.1%, or 6.37% adequate return on investments? Of course, there is no absolute answer since return requirements vary by investor, but you certainly have an ability to compare the investment example to other cash producing investment opportunities. Furthermore, the cash on cash return only paints a partial picture. The formula does not capture time value of money nor does it include increases in equity which can have a significant impact on other rate of return formulas such as Internal Rate of Return (IRR).
Dividend Analogy
I tell my students to think of the cash-on-cash return as a dividend yield. A property’s cash flow is a dividend, much like one would receive on a bond or dividend-paying stock. If you placed $10,000 into a certificate of deposit that pays 3% interest, then you would receive $300 per annum ($10,000 x 3%). The 3% interest rate is the cash-on-cash return for that particular investment. Hence, $300 is the dividend. Thinking of the cash-on-cash return in those terms helps you compare the property against other alternative investment opportunities.
The cash-on-cash return is a true cash-in cash-out formula. The “cash-in” is the annual cash flow and the “cash-out” is the initial investment. The formula uses the “net” cash flow, which has been reduced by all debt payments made in that particular year. This means the formula ignores principal payments, even though they reduced the loan balance and thus increased equity.
The formula also ignores the possibility that a property may have appreciated. Thus, the traditional calculation ignores two of the fundamental increases in equity (and thus, the net worth), debt reduction and appreciation. Cash-on-cash return with equity augments these shortcomings by modifying the traditional cash-on-cash formula to include the annual appreciation and the annual reduction in the loan balance.
How cash-on-cash return with equity is calculated
Cash-on-cash return with equity is quite similar to the traditional calculation, except that it attempts to expand the formula by adding changes in equity (usually increases) to the mix. The process involves marking the property to market. A mark-to-market approach essentially assumes a property sale at the end the year of measurement and estimates the net increase in equity (or “paper gain”) for that year. The annual increase in equity is added to the property’s net cash flow to makeup the formula’s numerator.
The annual equity increase (or decrease) for the year is derived from two sources. The first source is from the principal portion of loan payments made during the year of the measurement. The second source is from the “net” increase (or decrease) in the property’s value for the year of the measurement. We use the term “net” to mean the annual property appreciation (or decrease) less the associated sales expense and income.
To determine the denominator, we take all previous year’s increases (or decreases) of equity and add it to the initial investment. The denominator essentially becomes a rolling-forward amount of the “trapped equity.” Cash-on-Cash Return with Equity calculates a rate of return on this “trapped equity.”

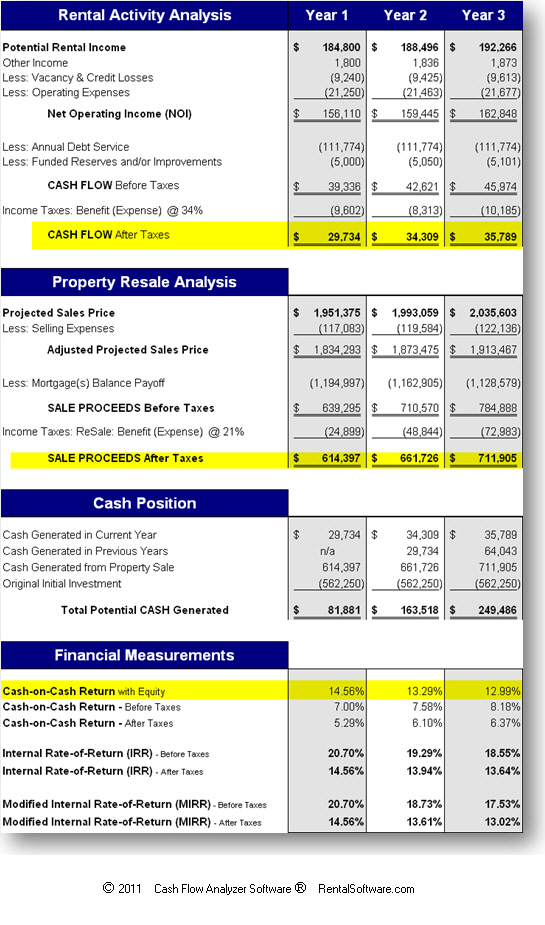
Let’s calculate the cash-on-cash return with equity by continuing the example:

Year 1’s Calculation
Year 1’s cash-on-cash return with equity is calculated by taking Year 1’s annual cash flow of $29,734 and adding the net increase in equity of $52,147. How did we arrive at $52,147? The equity increase was derived by subtracting the initial investment (or down payment) of $562,250 from Year 1’s Sale Proceeds – After Taxes of $614,397. Again, the net equity increase of $52,147 is after the associated sales expenses and income taxes.
The adjusted numerator is $81,881 ($29,734 + $52,147). The denominator remains $562,250, since there is no previous equity increases (or decreases) given that it is only Year 1. Hence, the cash-on-cash return with equity is computed to be 14.56% (81,881 / $562,250) for Year 1.
Year 2’s Calculation
The numerator for Year 2’s calculation is $81,636. This is determined by taking Year 2’s cash flow of $34,309 and adding Year 2’s net equity increase of $47,327. The net equity is determined by subtracting Year 1’s assumed sale proceeds of 614,397 from Year 2’s assumed sale proceeds of $661,726. Essentially, the investor earned $47,327 in new equity for holding the property one additional year.
Year 1’s sale proceeds – after taxes of $614,397 – is the amount of cash you would have received assuming the property was sold at the end of Year 1. Thus, this amount is our new “trapped equity” for Year 2, i.e., the denominator.
For Year 2, the cash on cash return with equity is 13.29% ($81,636 / 614,397).
Year 3’s Calculation
The numerator for Year 3’s calculation is $85,968. This is determined by taking Year 2’s cash flow of $35,789 and adding Year 3’s net equity increase of $50,179. The net equity is determined by subtracting Year 2’s assumed sale proceeds of $661,726 from Year 3’s assumed sale proceeds of $711,905. Essentially, the investor earned $50,179 in new equity for holding the property the third year.
Year 2’s sale proceeds – after taxes of $661,726 – is the amount of cash we would have received assuming the property was sold at the end of Year 2. Thus, this amount is our new “trapped equity” for Year 3, i.e., the denominator.
Note: You can also confirm the “trapped equity” amount by taking your initial investment of $562,250 and adding Year 1’s net equity increase of $52,147 and Year 2’s net equity increase of $47,327.
For Year 3, the cash on cash return with equity is 12.99% ($85,968 / $661,726).
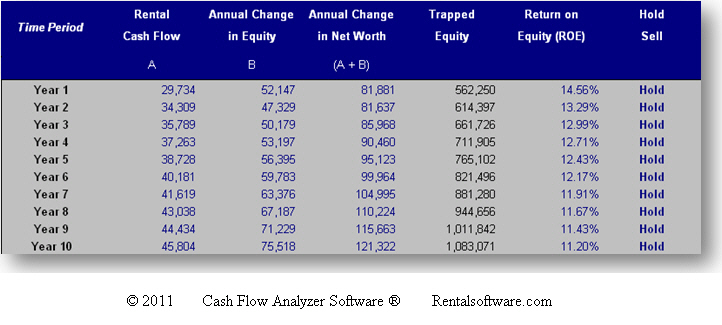
In our example, by holding the property for the third year, we earned 12.99% on the $661,726 “trapped equity.” If our investment return requirement is to earn 20% annually, we may want to consider selling the property. Conversely, if our requirement is only 10%, then we have exceeded our goal.
As part of the Cash Flow Analyzer® software, we have a Hold/Sell tool that automatically calculates the cash-on-cash return with equity every year up for to twenty years. Having these returns automatically calculated (and automatically updated) as you change a property’s financial information is critical to the real estate investment decision-making process.

Conclusions
When we own a property, we begin to accumulate equity in addition to our initial investment. As investors, we need to understand the rate-of-return on this “trapped equity” for decision-making purposes. If the returns on equity are acceptable, we know that we should probably continue to own the property. If the returns are not acceptable, this indicates that the property needs our attention, e.g., raise rents or reduce expenses, or the property should be sold and the proceeds re-invested in a better performing property or non-property investment.
© 2011 Douglas Rutherford, CPA. All Rights Reserved. Douglas Rutherford is a nationally recognized CPA practicing in the real estate industry. He is the founder of Rutherford, CPA & Associates, and the President and CEO of RentalSoftware.com. He is also the developer of the national leading real estate investment analysis software, the Cash Flow Analyzer ® & Flipper’s ® software products. Doug earned his Master of Taxation degree from Georgia State University, Atlanta, GA. Visit RealEstateAnalysisSoftwareBlog.com for more information and resources for successful real estate investing.
